

Edit a keyframe in the Graph Editor
A value graph in the Graph Editor displays the values for each keyframe and the interpolated values between keyframes. When the value graph of a layer property is level, the value of the property is unchanged between keyframes. When the value graph goes up or down, the value of a layer property increases or decreases between keyframes.
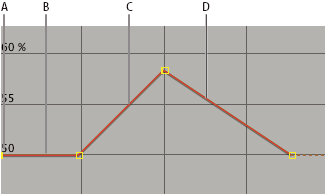
Value graph
- A.
- Keyframe.
- B.
- A level value graph indicates unchanging values.
- C.
- A rising graph indicates increasing values.
- D.
- A falling graph indicates decreasing values.
You can change layer property values by moving the points (keyframes) on the value graph up or down. For example, you can increase a Rotation keyframe’s value by dragging a keyframe marker on the Rotation property’s value graph higher up on the graph.
Note: Values for the Anchor
Point, Mask Path, effect control points, 3D Orientation, and Position
properties are spatial, so they use speed graphs by default instead
of value graphs.
- In the Timeline panel, display a temporal property for a layer.
- If necessary, click the Graph Editor button or press Shift+F3 to enter Graph Editor mode.
- If necessary, add a keyframe at the point in time you want the change to occur.
- Drag the keyframe up or down to set a new value for the layer property.