

Vectorscope
The
Vectorscope displays a circular chart, similar to a color wheel,
that shows the video’s chrominance information. Saturation is measured
from the center of the chart outward. Saturated, vivid colors produce
a pattern some distance from the center of the chart, while a black‑and‑white
image produces only a dot at the center of the chart. The particular
color, or hue, of the image determines the direction (angle of the
pattern). Small target boxes  indicate
where fully saturated magenta, blue, cyan, green, yellow, and red
(present in a color bars test pattern) should appear. In NTSC video,
chrominance levels should not exceed these target areas.
indicate
where fully saturated magenta, blue, cyan, green, yellow, and red
(present in a color bars test pattern) should appear. In NTSC video,
chrominance levels should not exceed these target areas.
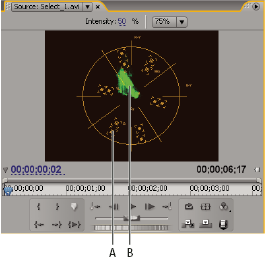
Vectorscope
- A.
- Target boxes
- B.
- Image profile
The Vectorscope has the following controls:
- Intensity
- Adjusts the brightness of the pattern display. It does not affect the video output signal.
- 75%
- Default position. Use to check video input in which standard 75% intensity bars, like those in Adobe Premiere Pro, are used.
- 100%
- Shows the entire range of video signal chrominance. Use with video input containing 100% intensity bars.